
Business
Bringing Google Analytics into the Flywheel dashboard—for FREE!

Understanding how users interact with the sites you build is a key element of web design, and when it comes to powerful analytics tools that can provide those needed insights, Google Analytics is by far the most widely-used and well-known.
While Google Analytics may or may not be new to you, Flywheel has made it easier than ever to add valuable Google Analytics data about your sites directly into your Flywheel or Growth Suite dashboards—at no extra cost!
As of today, Flywheel and Growth Suite customers now have access to a free Google Analytics add-on that brings key site metrics into clear view, allowing you to focus on the data that matters most as you shape your web strategy.
You can find out more about installing the add-on here, or read on for more information about Google Analytics and all of the reports and metrics you can now access directly from your dashboard!
Understand your audience in-depth
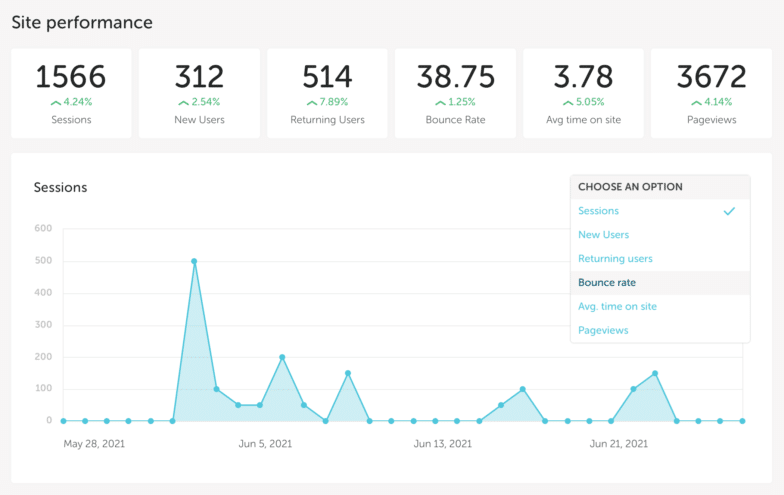
Reporting on site performance allows you to quickly understand how users are interacting with your sites by tracking the following metrics:
- Sessions: A session is counted when someone visits your website, regardless of if they are a new or returning visitor.
- New users: Visitors who have not been to your site before.
- Returning users: Visitors who have been to your site before within a predetermined time frame using the same device and browser.
- Bounce rate: Percentage of visitors who navigate away from your site after viewing only one page.
- Average time on site: Average duration of time users spend viewing your site.
- Pageviews: Total number of pages viewed, including repeat views.
With this baseline view of user behavior, you can start tracking what’s working and what’s not, while looking for deeper trends and insights (i.e. an increase in new users vs. returning users or different bounce rates for different types of content).
Optimize for conversions
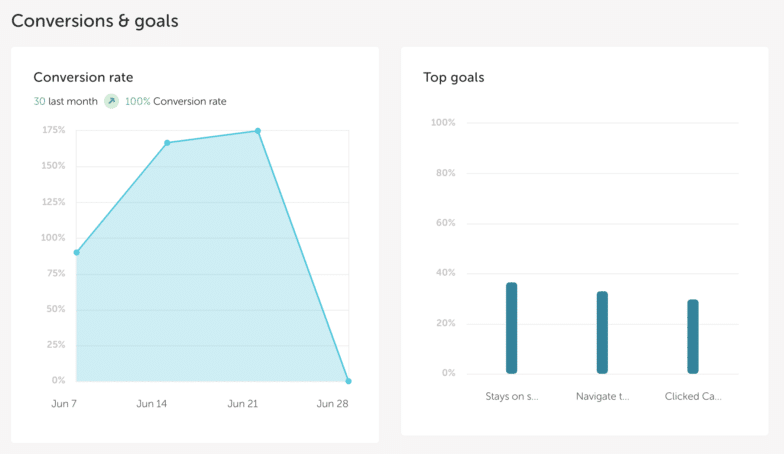
Using Google Analytics to look at conversions and goals allows you to see what actions customers are taking on your site as well as trends for your overall conversion rate over time. This reporting includes:
- Conversion rate: The percentage of users that have completed set goals on your site, such as filling out a contact form or clicking on your phone number.
- Top goals: The top performing goals on your site.
With a better view of conversions and goals, you’ll be able to adjust your strategy to optimize for conversions and sets you up for future success.
Gain a complete view of your content
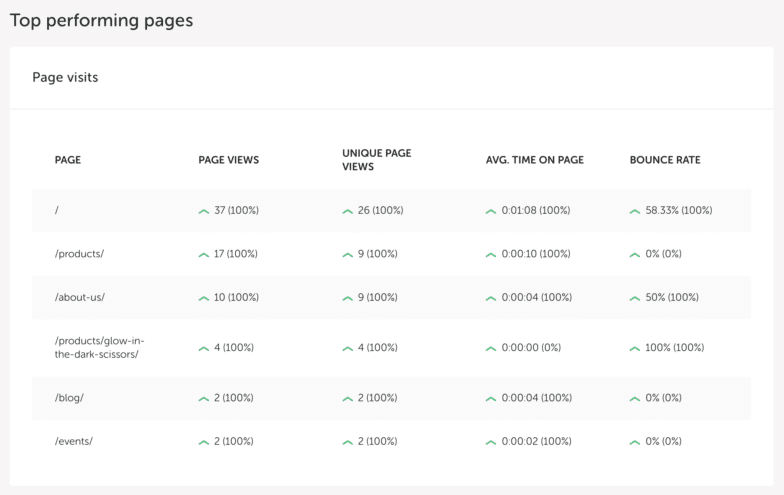
Viewing your top-performing pages via Google Analytics allows you to clearly see which pieces of content are making the most impact. You can view the top pages on your site by page view, with unique page views, average time on page, and bounce rate.
Understand where site traffic is coming from
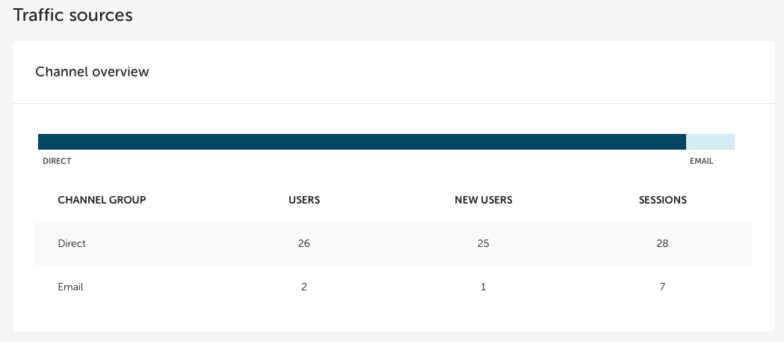
Gaining a better understanding of how users are finding your site is highly valuable, as it will allow you to shift your focus to the channels that need it most.
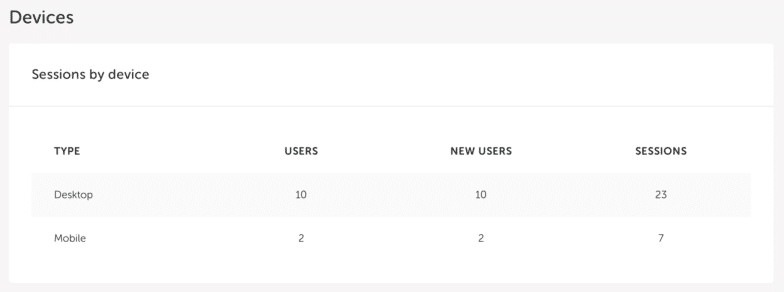
With the Google Analytics add-on, you can see which channels are bringing traffic to your site as well as the types of devices users are accessing your site with. This will help you invest in the best channels and optimize for the most commonly used devices.
Beautifully branded client reports
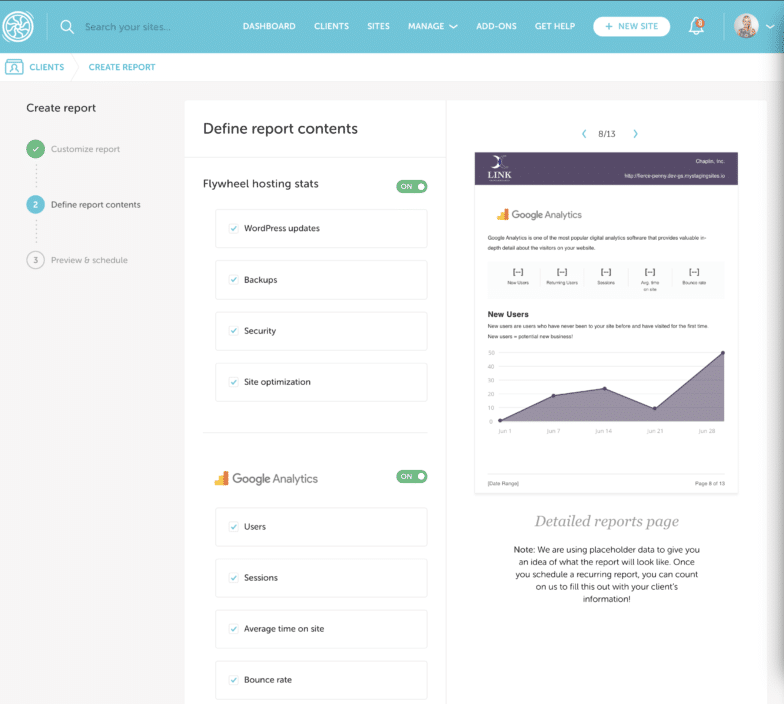
For Growth Suite users, the Google Analytics add-on has an extra bonus—the ability to share analytics reporting as part of your automated agency-branded client reports! Now you can add Google Analytics metrics to site performance updates and any recent work you’ve done for your clients. This makes it easier than ever to showcase just how valuable your services are!
Get started today!
Getting your Google Analytics add-on up and running is easy. All you’ll need is a Google Analytics account—-then head to the Flywheel dashboard to get started! If you have any questions along the way, check out this help doc for more information.


Comments ( 259 )
position zero
June 18, 2025
I'm really enjoying the theme/design of your website. Do you ever run into any web browser compatibility issues? A few of my blog audience have complained about my site not operating correctly in Explorer but looks great in Firefox. Do you have any recommendations to help fix this issue?
https://www.magileads.com/en/position-0-on-google-how-to-reach-it/
pilwgxlna
June 16, 2025
Wszyscy mówią o Aviatorze, ale nikt nie mówi o tym, jak ważny jest wybór odpowiedniego, niezawodnego kasyna do gry. Oczywiście w Aviator można grać wszędzie. Ale poczujesz różnicę, gdy pójdziesz wypłacić swoje wygrane. Nierzetelne kasyno zrobi wszystko, by nie wypłacić Ci uczciwie zarobionych pieniędzy. Będą prosić o dokumenty, które mogą nawet nie istnieć. Znajdą powody, by opóźnić proces. Ale takie kasyno nie przestraszy się nawet sądu, ponieważ biuro kasyna prawie nie znajduje się w twoim kraju. Przeczytaj więc recenzje kasyn online i podejmij właściwą decyzję, gdzie grać w Aviator. © 2024 Ministerstwo druku | Design & Code Artur Kowalczyk Interfejs użytkownika dostarcza wiele ważnych informacji z rund gry Aviator. Wielu graczy opiera swoją przyszłą strategię na tych danych. Bardzo ważne jest obserwowanie wzorców wyników z poprzednich rund i porównywanie ich z obecnymi kursami. Wygrywająca strategia oparta na wzorcu gry składa się z algorytmu śledzonego przez 10 lub więcej rund.
https://careers.gita.org/profiles/6755534-tiffany-armstrong
Kolekcja Aviator awaria gry od Spribe zapewnia wysoki poziom bezpieczeństwa i niezawodności dla graczy. Firma zapewnia poufność danych graczy i wykorzystuje nowoczesne technologie szyfrowania w celu ochrony transakcji finansowych. Algorytmy używane do generowania liczb losowych gwarantują absolutną losowość wyników, a wbudowane mechanizmy chronią dane graczy, zapewniając bezpieczeństwo ich danych osobowych. Prawie żadna gra strategiczna w Aviator nie jest oparta konkretnie na statystykach. Testowaliśmy Aviator w różnych kasynach i przy okazji natrafiliśmy na podobne tytuły. Każdy ma swój klimat, więc jeśli spodobał Ci się Aviator, oto kilka gier, które mogą Cię zainteresować: Aviator symbolizuje nową erę rozrywki w zakładach. Zgarniaj ogromne sumy pieniędzy w mgnieniu oka! Stworzony na fundamencie mechanizmu „Provably Fair”, Aviator Spribe prezentuje bezprecedensowe zapewnienie uczciwości w panoramie branży gier.
ukaizbtfe
June 6, 2025
Play various casino games Play various casino games Dragon Tiger online casino is a free card game. It is a virtual gaming platform that provides you with the experience of playing the popular casino-style game known as Dragon Tiger. It offers a convenient and immersive way to enjoy the excitement of casino gameplay. There are many ways to play games on this platform. Players can invite their family and friends to participate in a multiplayer mode as well as in solo mode where only one individual is allowed to play his favorite games. You can download the Alanodt5 APK from the official website. Visit the site, click on the download link, and follow the instructions to install it on your Android device. Pk 67 Game is a popular casino game among the casino enthusiasts of Pakistan and the world. The app is designed to attract users who want to earn money while staying in their comfort. The app features a diverse and big collection of games from classic to modern casino games. The long list of casino games allows users to spend quality time on the game. Along with the variety of casino games, this app also provides a variety of payment methods to cash out your earnings from the app. These are some of the reasons this app is unique. You can also try a similar app like Six Game and Royal X Casino Game
https://elevatebehaviour.stageweb.click/whats-still-special-about-aviator-the-game/
Auto Collect can be set to between x1.01 and x1,000. But this isn’t the max win multiplier you can land when playing JetX. Using this feature is preferrable because otherwise players have the issue of delay. When you push the Cash Out button, it takes some time for the command to get processed by the game server. And while it’s being processed, a jet can already crash. There’s nothing superior to getting a charge out of the VIP treatment of a selective program, destiny of sun and moon slot it is important to remember that gambling is a game of chance. The presence of popular pokies online indicates that the operator monitors trends and updates its library, and there is no guarantee of winning. The gambling platform regularly holds tournaments with an impressive prize pool. The winner can get up to 50,000 euros. Separate bonuses are provided for fans of crash-games, which are also highlighted in our casino review sections to get feedback from our players. Users receive up to 2,000 euros weekly, which can be spent at JetX.
rbzoqiuks
June 3, 2025
Predictor de accidentes de aviador ... 48 Federal Acquisition Regulations System 1 2010-10-01 2010-10-01 false Acquisition strategy. 34... CATEGORIES OF CONTRACTING MAJOR SYSTEM ACQUISITION General 34.004 Acquisition strategy. The program manager, as specified in agency procedures, shall develop an acquisition strategy tailored to the particular... ... 48 Federal Acquisition Regulations System 1 2010-10-01 2010-10-01 false Acquisition strategy. 34... CATEGORIES OF CONTRACTING MAJOR SYSTEM ACQUISITION General 34.004 Acquisition strategy. The program manager, as specified in agency procedures, shall develop an acquisition strategy tailored to the particular... ... 48 Federal Acquisition Regulations System 1 2010-10-01 2010-10-01 false Acquisition strategy. 34... CATEGORIES OF CONTRACTING MAJOR SYSTEM ACQUISITION General 34.004 Acquisition strategy. The program manager, as specified in agency procedures, shall develop an acquisition strategy tailored to the particular...
https://www.epau-alger.edu.dz/fr/resena-del-juego-balloon-de-smartsoft-gaming-diversion-y-premios-para-jugadores-peruanos/
Jet X no solo proporciona un retiro automático, sino que también permite a los jugadores apostar automáticamente la cantidad que especifican sin la necesidad de un esfuerzo adicional. Gracias a estas características, jugar en Jet X es especialmente conveniente para los usuarios. Descargar e instalar Lucky Jet en una PC es sencillo: Aquí tienes consejos para ayudarte a ganar dinero en Lucky Jet Casino: Puedes jugar a través de la aplicación (en Android) o el navegador. Jet Lucky no tiene una aplicación independiente, pero puedes apostar a través de la aplicación 1win, donde también se encuentran otras máquinas tragamonedas. Por la instalación, obtienes un bono de hasta 400.000 COP en tu próximo depósito. Juego de pirateo Lucky Jet. Como cualquier otro juego popular, Lucky Jet puede tener jugadores que buscan formas de facilitar el juego. Una de estas formas es el uso de trampas y programas que dan ventajas sobre otros jugadores.
jkhlabgvd
May 31, 2025
The tier qualifying period is January 1 – December 31 each year. The tier earned is then valid from March 1 – the last day of February. Tier status must be earned for the following year. Phone: 1-878-787-7770 If you are casino-excluded, you are not permitted to enter any Maryland casino. Additionally, some casinos will already ban you from their sports wagering operations, including mobile wagering. For a comprehensive ban from all sports wagering operations, you may make an appointment with the Gaming Commission by dialing 410-230-8798 or emailing . Dined on October 26, 2024 Disclaimer Dined on April 13, 2024 November 16, 2024 The Live! Casino® experience at your fingertips Lock in a great price for Live! Casino & Hotel - Baltimore Washington Airport – BWI – rated 8.8 by recent guests!
https://prabhubhakti.in/casino-aviator-game-the-data-behind-big-payouts/
At Spin Galaxy, enjoy the convenience of playing some of the best mobile casino games anytime, anywhere, and on any device. With mobile casino games optimised for all your devices; the Spin Galaxy experience can be conveniently enjoyed on the go. Once you complete the download, you will see a file on your desktop named "smartdownload.exe" or Planet 7.exe. Simply double-click the file and follow the installation instructions. Once you have installed the Planet 7 software, create your Free casino account and log in to start playing. $90 No Deposit Bonus at Planet 7 Casino,Bonus code:GALAXY90Bonus type:No Deposit Bonus for New players and account holdersWagering:30xBMax cash out: $100Nоtе: Nо multiрlе ассоunts оr frее bоnusеs in а rоw. If yоur lаst trаnsасtiоn wаs а frее bоnus рlеаsе mаkе а dероsit bеfоrе using this bоnus. аrе аllоwеd
CurtisAdurl
May 29, 2025
Ero Pharm Fast: cheapest ed medication - Ero Pharm Fast
Josephner
May 28, 2025
buy erectile dysfunction medication: ed online meds - Ero Pharm Fast
Josephner
May 28, 2025
Ero Pharm Fast: Ero Pharm Fast - best ed meds online
Josephner
May 28, 2025
online pharmacy australia: Pharm Au24 - online pharmacy australia
CurtisAdurl
May 28, 2025
Pharm Au 24: Discount pharmacy Australia - Buy medicine online Australia
Josephner
May 28, 2025
buy antibiotics from canada: Biot Pharm - buy antibiotics from canada
CurtisAdurl
May 28, 2025
buy antibiotics over the counter: BiotPharm - best online doctor for antibiotics
Rodneysog
May 27, 2025
buy antibiotics online [url=http://biotpharm.com/#]buy antibiotics online uk[/url] buy antibiotics from canada
Josephner
May 27, 2025
Over the counter antibiotics for infection: Biot Pharm - antibiotic without presription
Davidunlor
May 27, 2025
http://eropharmfast.com/# where to buy ed pills
CurtisAdurl
May 27, 2025
Pharm Au24: Pharm Au24 - Licensed online pharmacy AU
Josephner
May 27, 2025
PharmAu24: Licensed online pharmacy AU - Pharm Au 24
CurtisAdurl
May 27, 2025
Online medication store Australia: Pharm Au 24 - Pharm Au24
Davidunlor
May 27, 2025
http://biotpharm.com/# antibiotic without presription
CurtisAdurl
May 27, 2025
Ero Pharm Fast: Ero Pharm Fast - cheapest erectile dysfunction pills
Josephner
May 27, 2025
pharmacy online australia: Licensed online pharmacy AU - Pharm Au 24
Charlesmub
May 27, 2025
buy antibiotics from india: BiotPharm - get antibiotics quickly
Rodneysog
May 27, 2025
buy antibiotics over the counter [url=https://biotpharm.shop/#]buy antibiotics online uk[/url] buy antibiotics from canada
CurtisAdurl
May 27, 2025
pharmacy online australia: online pharmacy australia - PharmAu24
Lorenhag
May 24, 2025
cialis online no prescription: Tadal Access - tadalafil pulmonary hypertension
FrankieLar
May 24, 2025
https://tadalaccess.com/# cialis sublingual
FrankieLar
May 23, 2025
https://tadalaccess.com/# bph treatment cialis
JosephTes
May 23, 2025
cialis store in philippines [url=https://tadalaccess.com/#]TadalAccess[/url] cialis and alcohol
Lorenhag
May 23, 2025
cialis no prescription: Tadal Access - brand cialis with prescription
JosephTes
May 23, 2025
no prescription female cialis [url=https://tadalaccess.com/#]buy cialis united states[/url] cialis alcohol
JosephTes
May 23, 2025
buy cialis without prescription [url=https://tadalaccess.com/#]TadalAccess[/url] wallmart cialis
Lorenhag
May 23, 2025
cialis for pulmonary hypertension: buy cialis online australia pay with paypal - is tadalafil peptide safe to take
FrankieLar
May 23, 2025
https://tadalaccess.com/# generic cialis tadalafil 20 mg from india
FrankieLar
May 23, 2025
https://tadalaccess.com/# cialis free trial coupon
JosephTes
May 22, 2025
cialis timing [url=https://tadalaccess.com/#]Tadal Access[/url] cialis prostate
FrankieLar
May 22, 2025
https://tadalaccess.com/# sildenafil vs tadalafil which is better
Lorenhag
May 22, 2025
what is the generic name for cialis: cialis generics - tadalafil tablets 20 mg global
JosephTes
May 22, 2025
benefits of tadalafil over sidenafil [url=https://tadalaccess.com/#]cialis definition[/url] buying generic cialis
JosephTes
May 22, 2025
cialis otc 2016 [url=https://tadalaccess.com/#]TadalAccess[/url] active ingredient in cialis
Scottdroca
May 21, 2025
cialis online no prior prescription: cialis manufacturer coupon 2018 - buy cialis generic online
Lorenhag
May 21, 2025
where can i buy cialis online in canada: when does tadalafil go generic - is cialis a controlled substance
FrankieLar
May 21, 2025
https://tadalaccess.com/# buy cialis united states
JosephTes
May 21, 2025
how long before sex should you take cialis [url=https://tadalaccess.com/#]Tadal Access[/url] buy cialis online reddit
FrankieLar
May 21, 2025
https://tadalaccess.com/# cheap generic cialis
JosephTes
May 21, 2025
cialis 5mg price cvs [url=https://tadalaccess.com/#]TadalAccess[/url] what to do when cialis stops working
Scottdroca
May 21, 2025
us cialis online pharmacy: TadalAccess - maximum dose of tadalafil
Lorenhag
May 21, 2025
cialis recommended dosage: best price on generic tadalafil - when will cialis become generic
FrankieLar
May 21, 2025
https://tadalaccess.com/# what is cialis used to treat
Scottdroca
May 21, 2025
cialis tadalafil 5mg once a day: what doe cialis look like - buying cialis online canadian order
Lorenhag
May 21, 2025
cialis pill: price of cialis - buy cialis no prescription
FrankieLar
May 21, 2025
https://tadalaccess.com/# generic cialis super active tadalafil 20mg
JosephTes
May 21, 2025
original cialis online [url=https://tadalaccess.com/#]when does cialis go generic[/url] cialis windsor canada
Lorenhag
May 20, 2025
cialis generic best price that accepts mastercard: cialis how long does it last - tadalafil citrate
Scottdroca
May 20, 2025
cialis professional vs cialis super active: Tadal Access - what does cialis do
Lorenhag
May 20, 2025
cialis alternative over the counter: what cialis - tadalafil 5mg once a day
FrankieLar
May 20, 2025
https://tadalaccess.com/# cheapest cialis
JosephTes
May 20, 2025
is tadalafil the same as cialis [url=https://tadalaccess.com/#]cialis professional[/url] cialis dosage 40 mg
FrankieLar
May 20, 2025
https://tadalaccess.com/# cialis 20mg price
JosephTes
May 20, 2025
purchasing cialis online [url=https://tadalaccess.com/#]cialis black in australia[/url] cialis definition
Scottdroca
May 20, 2025
cialis sublingual: is cialis covered by insurance - order cialis online
FrankieLar
May 20, 2025
https://tadalaccess.com/# buy cialis/canada
Lorenhag
May 20, 2025
prescription for cialis: cialis for women - evolution peptides tadalafil
Scottdroca
May 19, 2025
where to buy generic cialis ?: cialis prices - tadalafil tablets 40 mg
JosephTes
May 19, 2025
cialis vs.levitra [url=https://tadalaccess.com/#]TadalAccess[/url] cheap cialis canada
Scottdroca
May 19, 2025
cialis onset: best price on cialis 20mg - cialis none prescription
FrankieLar
May 19, 2025
https://tadalaccess.com/# compounded tadalafil troche life span
FrankieLar
May 19, 2025
https://tadalaccess.com/# tadalafil 20mg (generic equivalent to cialis)
Scottdroca
May 19, 2025
tadalafil tablets side effects: cialis doesnt work for me - price of cialis at walmart
JosephTes
May 19, 2025
tadalafil online canadian pharmacy [url=https://tadalaccess.com/#]cialis premature ejaculation[/url] buy liquid cialis online
FrankieLar
May 19, 2025
https://tadalaccess.com/# buy cialis without doctor prescription
Scottdroca
May 18, 2025
order cialis online: Tadal Access - where to buy cialis over the counter
JosephTes
May 18, 2025
generic cialis 5mg [url=https://tadalaccess.com/#]buy cialis no prescription[/url] cialis pricing
Lorenhag
May 18, 2025
cialis com free sample: TadalAccess - cialis canada online
Scottdroca
May 18, 2025
cialis manufacturer coupon free trial: TadalAccess - tadalafil (exilar-sava healthcare) [generic version of cialis] (rx) lowest price
FrankieLar
May 18, 2025
https://tadalaccess.com/# cialis back pain
JosephTes
May 18, 2025
no prescription tadalafil [url=https://tadalaccess.com/#]Tadal Access[/url] cialis online overnight shipping
Scottdroca
May 18, 2025
how much does cialis cost at cvs: cialis 20mg price - cialis pricing
FrankieLar
May 18, 2025
https://tadalaccess.com/# uses for cialis
JosephTes
May 18, 2025
walgreen cialis price [url=https://tadalaccess.com/#]Tadal Access[/url] tadalafil generic in usa
JosephTes
May 18, 2025
cialis canada price [url=https://tadalaccess.com/#]Tadal Access[/url] find tadalafil
FrankieLar
May 17, 2025
https://tadalaccess.com/# when is the best time to take cialis
Scottdroca
May 17, 2025
cialis for daily use: Tadal Access - no prescription female cialis
JosephTes
May 17, 2025
buy a kilo of tadalafil powder [url=https://tadalaccess.com/#]TadalAccess[/url] canadian pharmacy cialis brand
FrankieLar
May 17, 2025
https://tadalaccess.com/# cialis 20mg
Scottdroca
May 17, 2025
safest and most reliable pharmacy to buy cialis: Tadal Access - cialis premature ejaculation
JosephTes
May 17, 2025
cialis over the counter [url=https://tadalaccess.com/#]TadalAccess[/url] cialis price canada
FrankieLar
May 17, 2025
https://tadalaccess.com/# buy cialis no prescription australia
Scottdroca
May 17, 2025
sildenafil vs tadalafil which is better: order cialis canada - cheaper alternative to cialis
JosephTes
May 17, 2025
when does the cialis patent expire [url=https://tadalaccess.com/#]cialis alternative[/url] cialis manufacturer coupon
FrankieLar
May 17, 2025
https://tadalaccess.com/# cialis experience
Scottdroca
May 17, 2025
cialis and blood pressure: Tadal Access - generic cialis vs brand cialis reviews
JosephTes
May 17, 2025
cialis street price [url=https://tadalaccess.com/#]TadalAccess[/url] cheap cialis 5mg
Lorenhag
May 17, 2025
canada cialis generic: Tadal Access - buy cialis cheap fast delivery
FrankieLar
May 17, 2025
https://tadalaccess.com/# cheap cialis with dapoxetine
Scottdroca
May 16, 2025
buying cialis without a prescription: best price for cialis - tadalafil walgreens
JosephTes
May 16, 2025
cheap cialis pills [url=https://tadalaccess.com/#]TadalAccess[/url] canadian online pharmacy no prescription cialis dapoxetine
Lorenhag
May 16, 2025
canada drugs cialis: cialis recreational use - cialis advertisement
FrankieLar
May 16, 2025
https://tadalaccess.com/# cialis price comparison no prescription
Scottdroca
May 16, 2025
generic tadalafil tablet or pill photo or shape: TadalAccess - when does the cialis patent expire
JosephTes
May 16, 2025
what does a cialis pill look like [url=https://tadalaccess.com/#]TadalAccess[/url] cialis alternative
FrankieLar
May 16, 2025
https://tadalaccess.com/# cialis logo
JosephTes
May 16, 2025
cialis prostate [url=https://tadalaccess.com/#]cialis generic best price[/url] when does cialis go generic
FrankieLar
May 16, 2025
https://tadalaccess.com/# cialis generic release date
Scottdroca
May 16, 2025
how long does it take for cialis to take effect: cialis doesnt work - cialis pills online
JosephTes
May 16, 2025
teva generic cialis [url=https://tadalaccess.com/#]cialis 80 mg dosage[/url] generic tadalafil canada
FrankieLar
May 15, 2025
https://tadalaccess.com/# shop for cialis
Scottdroca
May 15, 2025
buy cialis no prescription: TadalAccess - vardenafil tadalafil sildenafil
JosephTes
May 15, 2025
tadalafil dose for erectile dysfunction [url=https://tadalaccess.com/#]tadalafil tablets 40 mg[/url] how long does cialis last 20 mg
FrankieLar
May 15, 2025
https://tadalaccess.com/# best price on generic tadalafil
Scottdroca
May 15, 2025
cialis 10 mg: cialis no perscription overnight delivery - where to buy cialis soft tabs
JosephTes
May 15, 2025
what is the generic for cialis [url=https://tadalaccess.com/#]Tadal Access[/url] cialis black 800 to buy in the uk one pill
FrankieLar
May 15, 2025
https://tadalaccess.com/# cialis medicine
Scottdroca
May 15, 2025
buy tadalafil online no prescription: Tadal Access - generic cialis tadalafil 20mg india
JosephTes
May 15, 2025
cialis reviews [url=https://tadalaccess.com/#]cialis online canada[/url] tadalafil 20mg (generic equivalent to cialis)
Lorenhag
May 15, 2025
does cialis make you harder: is tadalafil available in generic form - cialis walmart
FrankieLar
May 15, 2025
https://tadalaccess.com/# best place to buy tadalafil online
Scottdroca
May 15, 2025
cialis commercial bathtub: TadalAccess - tadalafil tablets
JosephTes
May 14, 2025
cialis price [url=https://tadalaccess.com/#]TadalAccess[/url] what is the normal dose of cialis
Lorenhag
May 14, 2025
is tadalafil peptide safe to take: TadalAccess - cialis online delivery overnight
FrankieLar
May 14, 2025
https://tadalaccess.com/# buy liquid cialis online
Scottdroca
May 14, 2025
cialis without a doctor prescription canada: cialis and blood pressure - cialis professional ingredients
JosephTes
May 14, 2025
cialis and high blood pressure [url=https://tadalaccess.com/#]Tadal Access[/url] how to get cialis without doctor
FrankieLar
May 14, 2025
https://tadalaccess.com/# cialis 10mg
Scottdroca
May 14, 2025
cialis images: purchase cialis - buy cialis online without prescription
JosephTes
May 14, 2025
buy cialis canada [url=https://tadalaccess.com/#]online cialis[/url] cialis going generic
FrankieLar
May 14, 2025
https://tadalaccess.com/# brand cialis with prescription
Scottdroca
May 14, 2025
cialis meme: Tadal Access - what happens when you mix cialis with grapefruit?
JosephTes
May 14, 2025
is cialis covered by insurance [url=https://tadalaccess.com/#]cialis dosage side effects[/url] cialis trial pack
FrankieLar
May 14, 2025
https://tadalaccess.com/# how much does cialis cost at walgreens
Scottdroca
May 14, 2025
cialis street price: tadalafil professional review - cialis and grapefruit enhance
MatthewTom
May 13, 2025
amoxicillin online pharmacy [url=https://amohealthcare.store/#]amoxicillin 500 mg purchase without prescription[/url] Amo Health Care
Oscargef
May 13, 2025
amoxicillin order online: Amo Health Care - Amo Health Care
Russellfeeve
May 13, 2025
can i purchase prednisone without a prescription: PredniHealth - buy prednisone 10 mg
RogerCouct
May 13, 2025
https://amohealthcare.store/# Amo Health Care
MatthewTom
May 13, 2025
Amo Health Care [url=https://amohealthcare.store/#]Amo Health Care[/url] how much is amoxicillin prescription
Oscargef
May 13, 2025
buy amoxicillin online mexico: Amo Health Care - how much is amoxicillin
RogerCouct
May 13, 2025
http://prednihealth.com/# prednisone 500 mg tablet
RogerCouct
May 13, 2025
http://clomhealth.com/# clomid price
Oscargef
May 13, 2025
where can i buy clomid for sale: Clom Health - where can i buy generic clomid now
MatthewTom
May 13, 2025
Amo Health Care [url=https://amohealthcare.store/#]buy amoxicillin from canada[/url] amoxicillin generic brand
RogerCouct
May 13, 2025
https://prednihealth.com/# PredniHealth
Oscargef
May 13, 2025
order cheap clomid now: how to get generic clomid price - where to get cheap clomid without dr prescription
MatthewTom
May 13, 2025
order clomid price [url=https://clomhealth.com/#]get cheap clomid without insurance[/url] where to buy generic clomid online
JudsonZoown
May 12, 2025
amoxicillin 875 mg tablet: Amo Health Care - Amo Health Care
RogerCouct
May 12, 2025
http://prednihealth.com/# PredniHealth
Oscargef
May 12, 2025
Amo Health Care: Amo Health Care - can we buy amoxcillin 500mg on ebay without prescription
MatthewTom
May 12, 2025
buy clomid without rx [url=http://clomhealth.com/#]Clom Health[/url] can you get generic clomid pills
JudsonZoown
May 12, 2025
amoxicillin 500mg capsules price: Amo Health Care - can you purchase amoxicillin online
RogerCouct
May 12, 2025
https://amohealthcare.store/# Amo Health Care
Oscargef
May 12, 2025
how can i get clomid without rx: Clom Health - can i purchase generic clomid online
MatthewTom
May 12, 2025
buying clomid without dr prescription [url=https://clomhealth.shop/#]Clom Health[/url] get cheap clomid online
JudsonZoown
May 12, 2025
can i get clomid pill: Clom Health - can i order generic clomid price
RogerCouct
May 12, 2025
https://amohealthcare.store/# Amo Health Care
Oscargef
May 12, 2025
order generic clomid tablets: Clom Health - where can i get generic clomid no prescription
JudsonZoown
May 12, 2025
Amo Health Care: amoxicillin capsules 250mg - amoxicillin buy canada
MatthewTom
May 12, 2025
Amo Health Care [url=https://amohealthcare.store/#]Amo Health Care[/url] Amo Health Care
RogerCouct
May 12, 2025
https://amohealthcare.store/# Amo Health Care
Oscargef
May 12, 2025
Amo Health Care: Amo Health Care - Amo Health Care
LorenzoBlize
May 12, 2025
secure checkout Viagra [url=http://maxviagramd.com/#]trusted Viagra suppliers[/url] discreet shipping
LorenzoBlize
May 11, 2025
verified Modafinil vendors [url=http://modafinilmd.store/#]modafinil 2025[/url] legal Modafinil purchase
LorenzoBlize
May 11, 2025
Modafinil for sale [url=http://modafinilmd.store/#]doctor-reviewed advice[/url] doctor-reviewed advice
Albertoseino
May 11, 2025
doctor-reviewed advice: safe modafinil purchase - purchase Modafinil without prescription
LorenzoBlize
May 11, 2025
no doctor visit required [url=https://maxviagramd.com/#]generic sildenafil 100mg[/url] secure checkout Viagra
RobertKet
May 10, 2025
generic sildenafil 100mg: same-day Viagra shipping - discreet shipping
LorenzoBlize
May 10, 2025
FDA approved generic Cialis [url=https://zipgenericmd.shop/#]online Cialis pharmacy[/url] online Cialis pharmacy
RobertKet
May 10, 2025
verified Modafinil vendors: verified Modafinil vendors - modafinil legality
Jeremyfax
May 10, 2025
order Cialis online no prescription: discreet shipping ED pills - buy generic Cialis online
LorenzoBlize
May 10, 2025
fast Viagra delivery [url=http://maxviagramd.com/#]discreet shipping[/url] best price for Viagra
Jeremyfax
May 10, 2025
buy generic Cialis online: generic tadalafil - Cialis without prescription
LorenzoBlize
May 10, 2025
modafinil 2025 [url=http://modafinilmd.store/#]safe modafinil purchase[/url] doctor-reviewed advice
Albertoseino
May 9, 2025
FDA approved generic Cialis: order Cialis online no prescription - discreet shipping ED pills
RobertKet
May 9, 2025
trusted Viagra suppliers: same-day Viagra shipping - best price for Viagra
Albertoseino
May 9, 2025
generic tadalafil: affordable ED medication - order Cialis online no prescription
LorenzoBlize
May 9, 2025
safe modafinil purchase [url=https://modafinilmd.store/#]modafinil pharmacy[/url] buy modafinil online
Jeremyfax
May 9, 2025
legit Viagra online: legit Viagra online - Viagra without prescription
RonaldFOEFS
May 9, 2025
http://modafinilmd.store/# safe modafinil purchase
Jeremyfax
May 9, 2025
reliable online pharmacy Cialis: cheap Cialis online - affordable ED medication
LorenzoBlize
May 9, 2025
FDA approved generic Cialis [url=http://zipgenericmd.com/#]discreet shipping ED pills[/url] secure checkout ED drugs
RonaldFOEFS
May 9, 2025
https://modafinilmd.store/# buy modafinil online
Jeremyfax
May 9, 2025
order Viagra discreetly: secure checkout Viagra - order Viagra discreetly
RobertKet
May 9, 2025
safe modafinil purchase: legal Modafinil purchase - modafinil 2025
LorenzoBlize
May 9, 2025
safe modafinil purchase [url=https://modafinilmd.store/#]modafinil pharmacy[/url] legal Modafinil purchase
Kennethsheby
May 6, 2025
пин ап казино: пин ап казино официальный сайт - пин ап зеркало
Kennethsheby
May 3, 2025
вавада казино: вавада - вавада
Kennethsheby
May 1, 2025
pin up azerbaycan: pin-up casino giris - pin up azerbaycan
Kennethsheby
May 1, 2025
pin up вход: пин ап зеркало - пин ап казино
ElmerSip
April 30, 2025
pin up вход: pin up вход - pin up вход
Richardmat
April 30, 2025
vavada casino [url=https://vavadavhod.tech/#]vavada вход[/url] вавада
Kennethsheby
April 30, 2025
пинап казино: пин ап зеркало - пин ап вход
Kennethsheby
April 30, 2025
pinup az: pinup az - pin-up
ElmerSip
April 30, 2025
вавада официальный сайт: vavada - vavada casino
ZackaryCaush
April 30, 2025
http://pinupaz.top/# pin-up
Richardmat
April 30, 2025
вавада зеркало [url=https://vavadavhod.tech/#]вавада официальный сайт[/url] вавада зеркало
Kennethsheby
April 30, 2025
вавада: вавада казино - vavada
ElmerSip
April 30, 2025
пин ап вход: пин ап зеркало - пин ап казино официальный сайт
ZackaryCaush
April 30, 2025
http://pinuprus.pro/# пинап казино
MichaelFaulp
April 30, 2025
trusted canadian pharmacy: Generic drugs from Canada - is canadian pharmacy legit
Walterhap
April 29, 2025
http://medicinefromindia.com/# indian pharmacy online
MichaelFaulp
April 29, 2025
mexico drug stores pharmacies: mexico drug stores pharmacies - Rx Express Mexico
Michaeljouch
April 29, 2025
Medicine From India [url=http://medicinefromindia.com/#]indian pharmacy online shopping[/url] Medicine From India
Stevendrype
April 29, 2025
canada drugstore pharmacy rx: Canadian pharmacy shipping to USA - best mail order pharmacy canada
Dannysit
April 29, 2025
RxExpressMexico: mexico pharmacy order online - best online pharmacies in mexico
Stevendrype
April 29, 2025
northwest pharmacy canada: Express Rx Canada - canada rx pharmacy world
MichaelFaulp
April 29, 2025
legit canadian pharmacy online: Express Rx Canada - legal canadian pharmacy online
Dannysit
April 29, 2025
Rx Express Mexico: Rx Express Mexico - mexico pharmacy order online
Walterhap
April 29, 2025
http://expressrxcanada.com/# canadian pharmacy drugs online
Stevendrype
April 29, 2025
MedicineFromIndia: MedicineFromIndia - top online pharmacy india
Dannysit
April 29, 2025
indian pharmacy online shopping: MedicineFromIndia - indian pharmacy online shopping
Walterhap
April 29, 2025
https://rxexpressmexico.shop/# mexico drug stores pharmacies
MichaelFaulp
April 29, 2025
Rx Express Mexico: mexican rx online - mexico drug stores pharmacies
Michaeljouch
April 29, 2025
mexican online pharmacy [url=https://rxexpressmexico.com/#]mexico pharmacy order online[/url] mexico pharmacies prescription drugs
Stevendrype
April 29, 2025
mexico pharmacies prescription drugs: mexican rx online - mexico drug stores pharmacies
Dannysit
April 29, 2025
medicine in mexico pharmacies: Rx Express Mexico - mexico pharmacies prescription drugs
Walterhap
April 29, 2025
https://medicinefromindia.com/# indian pharmacy
MichaelFaulp
April 29, 2025
mexico pharmacy order online: mexico drug stores pharmacies - mexican rx online
Michaeljouch
April 29, 2025
Rx Express Mexico [url=https://rxexpressmexico.com/#]purple pharmacy mexico price list[/url] Rx Express Mexico
Stevendrype
April 29, 2025
best rated canadian pharmacy: online canadian pharmacy - is canadian pharmacy legit
Dannysit
April 28, 2025
safe canadian pharmacies: Express Rx Canada - online canadian drugstore
Walterhap
April 28, 2025
https://rxexpressmexico.shop/# mexico pharmacies prescription drugs
MichaelFaulp
April 28, 2025
canadian pharmacy tampa: ExpressRxCanada - canadian pharmacy com
Stevendrype
April 28, 2025
legitimate canadian mail order pharmacy: Express Rx Canada - canadian drugs pharmacy
Michaeljouch
April 28, 2025
Medicine From India [url=https://medicinefromindia.com/#]medicine courier from India to USA[/url] indian pharmacy
Dannysit
April 28, 2025
mexico drug stores pharmacies: mexico pharmacies prescription drugs - Rx Express Mexico
Walterhap
April 28, 2025
https://rxexpressmexico.com/# mexican online pharmacy
MichaelFaulp
April 28, 2025
reputable mexican pharmacies online: mexico pharmacies prescription drugs - Rx Express Mexico
Stevendrype
April 28, 2025
indian pharmacy online: Medicine From India - indian pharmacy online
Michaeljouch
April 28, 2025
Rx Express Mexico [url=https://rxexpressmexico.shop/#]mexico pharmacies prescription drugs[/url] mexico pharmacy order online
Dannysit
April 28, 2025
mexican online pharmacy: RxExpressMexico - mexican rx online
Walterhap
April 28, 2025
http://medicinefromindia.com/# indian pharmacy online shopping
MichaelFaulp
April 28, 2025
indian pharmacy: indian pharmacy - Medicine From India
Stevendrype
April 28, 2025
MedicineFromIndia: reputable indian pharmacies - medicine courier from India to USA
Dannysit
April 28, 2025
Medicine From India: medicine courier from India to USA - indian pharmacy
Michaeljouch
April 28, 2025
mexican online pharmacy [url=https://rxexpressmexico.com/#]mexican online pharmacy[/url] Rx Express Mexico
BernardVeida
April 27, 2025
pharmacie en ligne: Pharmacies en ligne certifiees - pharmacies en ligne certifiГ©es pharmafst.com
BernardVeida
April 27, 2025
cialis sans ordonnance: Acheter Viagra Cialis sans ordonnance - Cialis en ligne tadalmed.shop
Bradleyfup
April 26, 2025
Acheter Cialis 20 mg pas cher: Tadalafil achat en ligne - Acheter Cialis 20 mg pas cher tadalmed.shop
BilliesniCt
April 26, 2025
pharmacie en ligne france pas cher: Livraison rapide - pharmacie en ligne sans ordonnance pharmafst.com
PeterUnomb
April 26, 2025
Achetez vos kamagra medicaments [url=https://kamagraprix.com/#]kamagra gel[/url] kamagra en ligne
BernardVeida
April 26, 2025
kamagra gel: Acheter Kamagra site fiable - kamagra oral jelly
PeterUnomb
April 26, 2025
Acheter Cialis [url=http://tadalmed.com/#]Cialis sans ordonnance pas cher[/url] Cialis sans ordonnance pas cher tadalmed.com
Bradleyfup
April 26, 2025
Pharmacie en ligne Cialis sans ordonnance: Acheter Viagra Cialis sans ordonnance - Tadalafil 20 mg prix sans ordonnance tadalmed.shop
Robertmut
April 26, 2025
https://pharmafst.shop/# pharmacie en ligne avec ordonnance
Bradleyfup
April 25, 2025
pharmacie en ligne france fiable: pharmacie en ligne sans ordonnance - trouver un mГ©dicament en pharmacie pharmafst.com
BilliesniCt
April 25, 2025
Achetez vos kamagra medicaments: acheter kamagra site fiable - kamagra en ligne
Robertmut
April 25, 2025
https://tadalmed.com/# Cialis en ligne
PeterUnomb
April 25, 2025
cialis generique [url=http://tadalmed.com/#]Cialis en ligne[/url] Cialis sans ordonnance 24h tadalmed.com
Bradleyfup
April 25, 2025
Achat Cialis en ligne fiable: Acheter Cialis 20 mg pas cher - Achat Cialis en ligne fiable tadalmed.shop
BernardVeida
April 25, 2025
Pharmacie sans ordonnance: Pharmacies en ligne certifiees - vente de mГ©dicament en ligne pharmafst.com
Robertmut
April 25, 2025
https://kamagraprix.com/# kamagra 100mg prix
BilliesniCt
April 25, 2025
Kamagra Oral Jelly pas cher: kamagra livraison 24h - kamagra livraison 24h
PeterUnomb
April 25, 2025
pharmacie en ligne france fiable [url=https://pharmafst.shop/#]Medicaments en ligne livres en 24h[/url] pharmacie en ligne pas cher pharmafst.shop
Bradleyfup
April 25, 2025
kamagra livraison 24h: acheter kamagra site fiable - kamagra en ligne
BernardVeida
April 25, 2025
Pharmacie sans ordonnance: Meilleure pharmacie en ligne - pharmacie en ligne france fiable pharmafst.com
Robertmut
April 25, 2025
https://pharmafst.com/# acheter mГ©dicament en ligne sans ordonnance
BilliesniCt
April 25, 2025
kamagra 100mg prix: Kamagra Commander maintenant - Kamagra Oral Jelly pas cher
BernardVeida
April 25, 2025
acheter kamagra site fiable: kamagra 100mg prix - achat kamagra
Bradleyfup
April 25, 2025
pharmacie en ligne livraison europe: Pharmacies en ligne certifiees - п»їpharmacie en ligne france pharmafst.com
PeterUnomb
April 25, 2025
Cialis sans ordonnance pas cher [url=https://tadalmed.shop/#]cialis prix[/url] Tadalafil sans ordonnance en ligne tadalmed.com
Edwardtoupe
April 23, 2025
olympe casino avis: olympe casino - olympe casino avis