Debug your website site using Query Monitor

Query Monitor is a free WordPress® plugin which provides concise insights about the performance of your site’s pages.1 It offers an in-browser dashboard which allows you to debug database queries, view PHP errors, see plugin/theme contributions, view API calls, and more.
How does Query Monitor help me improve my site?
The Query Monitor plugin is a great debugging tool for helping to determine the root cause of performance issues, namely those caused by themes, plugins, external services, and other site-level issues which might need to be addressed.
Alongside this, the plugin also gives insights into the server’s contribution to performance, making it a good tool to check if you believe the server is running into limitations as well.
Table of Contents:
Using Query Monitor
First things first, be sure to install Query Monitor and activate it on your site.
Warning
Query Monitor does add a slight strain to your server as long as it is active, since it is actively monitoring each part of the page’s load. It’s generally a good idea to disable the plugin when you are done actively auditing the site for the day, since in rare cases it can cause performance issues.Accessing the dashboard
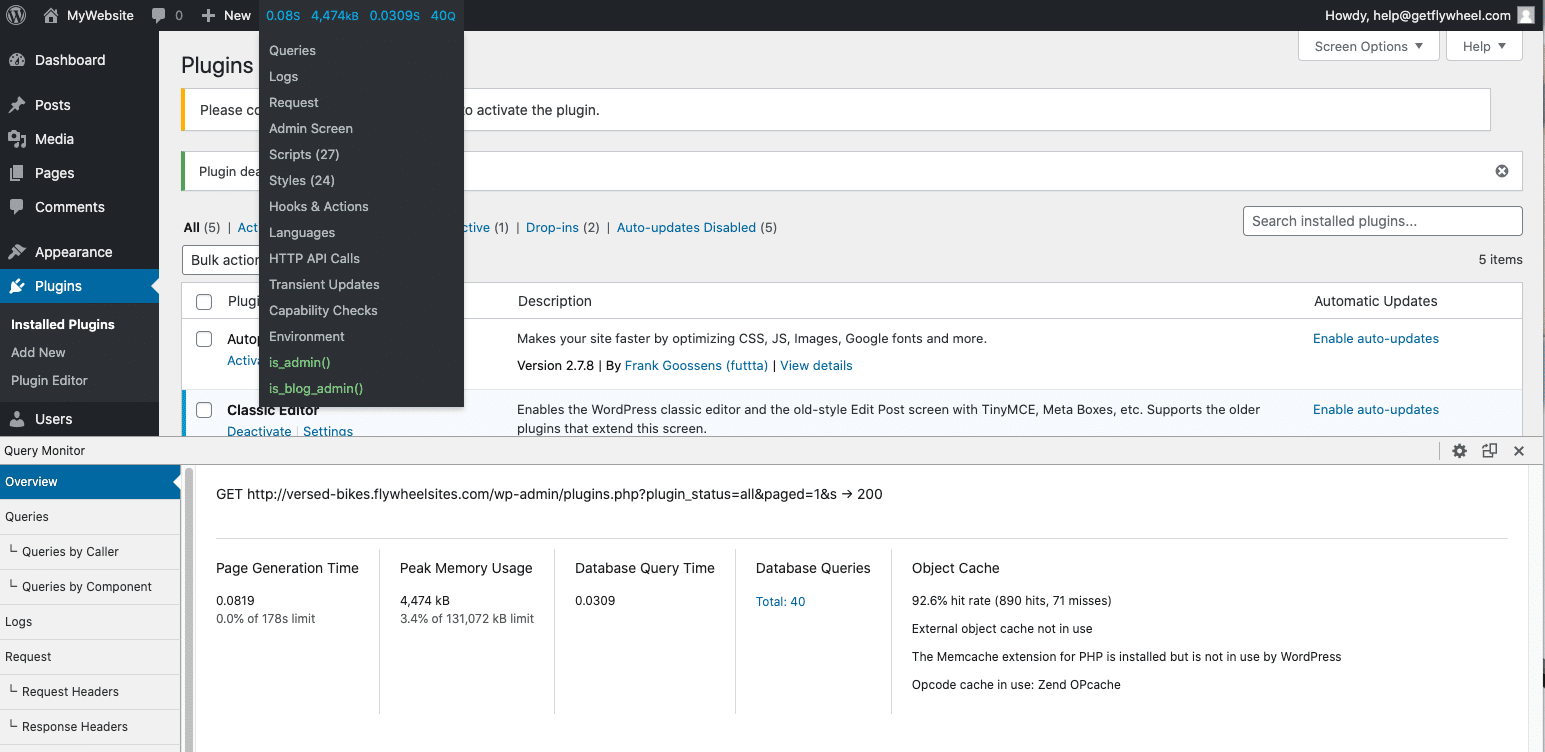
Once the plugin is operational, a new block of numbers will appear within the WP-Admin dashboard admin bar at the top of the page. Hovering over them will give you a dropdown list of various sections within Query Monitor, while clicking on any of them will bring up the Query Monitor auditing window itself (which will dock to the bottom of your browser window by default).
Overview tab
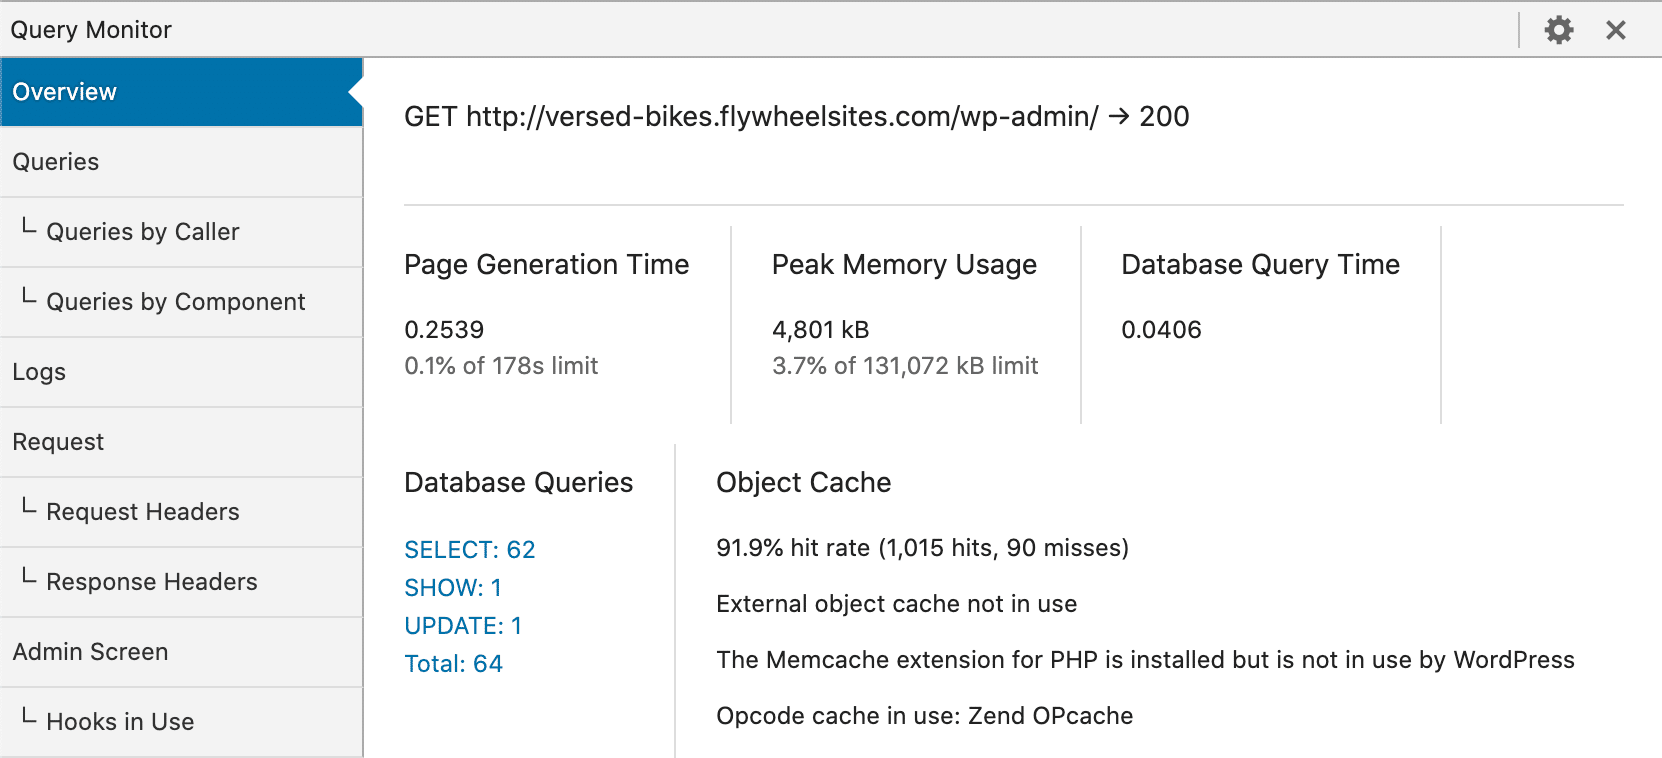
Once inside Query Monitor’s dashboard, the default view will be of the Overview section, which outlines the page’s performance at a glance.

The main three areas to be aware of are:
- Page Generation Time, or how long it took for the page itself to get created.
- Peak Memory Usage, which is the highest amount of memory used while creating this page. You always want the Usage number to be lower than the Limit number.
- Database Query Time, which is how long the database itself took to respond to requests from the theme/plugins. This number will be the ‘total’ of all individual contributors within the “Query” section, so if this is a low number, then plugins and themes are likely not related.
Queries tab
The next most useful section is under the Queries tab, specifically the Queries by Component area. It breaks down the contributions to the page load by source, so it’s a great place to begin looking for slowness coming within the site itself.
You’ll be able to see Core (which is WordPress itself), as well as the names of each individual plugin and theme. You can click into each of the contributors to see more detailed information as well.
PHP Errors tab
Another handy tool within Query Monitor is its ability to point you to PHP Errors, Warnings, and Notices to help debug potential issues within the theme/plugin code. If any are present, a new tab will appear named PHP Errors, which shows the “level” of severity, as well as what message the issue came along with and where the issue occurred. 
The location of the issue helps to inform you of which area of the site the problem stemmed from. In the example above, the issue occurred in a theme named “twentytwenty” within the “footer.php” file on line 60.
HTTP API Calls tab
The final tab this article will cover is the HTTP API Calls tab, which outlines any sort of POST/AJAX call which happened on the page. These can be useful in helping to determine if dynamic content on the page is holding up the page load at all.
This is most commonly seen with theme or plugins which rely on third-party services to provide information to the page, or if there are long-lived calls to the server itself to fetch new information to display. This can be a great tool for helping to determine if slow calls are the culprit behind a page’s poor performance.
Need help?
If you have any questions our Happiness Engineers are here to help!
If you discover problems within Query Monitor itself, you can reach out to Query Monitor’s support team directly as well.
Getting Started
New to Flywheel? Start here, we've got all the information you'll need to get started and launch your first site!
View all
Account Management
Learn all about managing your Flywheel user account, Teams and integrations.
View all
Features
Flywheel hosting plans include a ton of great features. Learn about how to get a free SSL certificate, set up a staging site, and more!
View all
Platform Info
All the server and setting info you'll need to help you get the most out of your Flywheel hosting plan!
View all
Site Management
Tips and tricks for managing your sites on Flywheel, including going live, troubleshooting issues and migrating or cloning sites.
View all
Growth Suite
Learn more about Growth Suite, our all-in-one solution for freelancers and agencies to grow more quickly and predictably.
Getting started with Growth Suite
Growth Suite: What are invoice statuses?
Growth Suite: What do client emails look like?

Managed Plugin Updates
Learn more about Managed Plugin Updates, and how you can keep your sites up to date, and extra safe.
-
Restoring Plugin and Theme Management on Flywheel
-
Managed Plugin Updates: Database upgrades
-
Managed Plugin Updates: Pause plugin updates

Local
View the Local help docs
Looking for a logo?
We can help! Check out our Brand Resources page for links to all of our brand assets.
Brand Resources All help articles